
Original Research
9 (
178-181
3
); 178-181
doi:
10.25259/APOS_19_2019
Applicability of two non-radiographic tooth size prediction methods of unerupted permanent canine and premolars, for Galle district, Sri Lanka
1Department of Orthodontics, Teaching Hospital, Karapitiya, Sri Lanka
2Wedasara Foundation, Galle, Sri Lanka

Published: 2019-09-28,
Accepted: 2019-03-13,
Received: 2019-03-13
How to cite this article: Perera WK, Gunawardane S, Pathirage SL. Applicability of two non-radiographic tooth size prediction methods of unerupted permanent canine and premolars, for Galle district, Sri Lanka. APOS Trends Orthod 2019;9(3):178-81.
Accepted: 2019-03-13,
Received: 2019-03-13
© 2019 Published by Scientific Scholar on behalf of APOS Trends in Orthodontics
Licence
This is an open-access article distributed under the terms of the Creative Commons Attribution-Non Commercial-Share Alike 4.0 License, which allows others to remix, tweak, and build upon the work non-commercially, as long as the author is credited and the new creations are licensed under the identical terms.
This is an open-access article distributed under the terms of the Creative Commons Attribution-Non Commercial-Share Alike 4.0 License, which allows others to remix, tweak, and build upon the work non-commercially, as long as the author is credited and the new creations are licensed under the identical terms.
How to cite this article: Perera WK, Gunawardane S, Pathirage SL. Applicability of two non-radiographic tooth size prediction methods of unerupted permanent canine and premolars, for Galle district, Sri Lanka. APOS Trends Orthod 2019;9(3):178-81.
Abstract
Introduction:
Mixed dentition space analysis necessitates accurate prediction of size of the unerupted permanent teeth. The methods commonly employed are the radiographs, correlation and regression equations, or a combination. Much interest was developed on the application of prediction tables and regression equations to avoid the radiation exposure. However, the predicted values and equations have been reported to be inaccurate on populations other than on which they were developed on. We intended to evaluate the applicability of the Moyer’s probability table and Tanaka Johnston equation in estimating the mesiodistal widths of mandibular and maxillary permanent canines and premolars in adolescents of the Galle District.Material and Methods:
Data were collected from study models of 318 randomly selected school students aged 13– 16 years with fully erupted, intact dentitions and no significant malocclusion. The measurements were obtained by a digital caliper with a Vernier scale calibrated to the nearest 0.01 mm. The data were subjected to statistical analysis to compare the actual and predicted values from Moyer’s probability table and Tanaka Johnston equation.Results:
There was a statistically significant difference when Pearson correlation two-tailed significance test was used. The actual mesiodistal width of permanent canines and premolars and predicted widths from Moyer’s probability chart at all levels for males and females showed a statistically significant difference at 0.01 level. The values from Tanaka Johnston equation also showed a statistically significant difference at P = 0.01/R = 0.47.Conclusion:
Moyer’s prediction table and Tanaka Johnston equation must be carefully used for children in Galle District, Sri Lanka. Therefore, it might be safer to develop regression equations for our population.Keywords
Mixed dentition analysis
Tooth width prediction
Regression equations
INTRODUCTION
In orthodontics, space analysis quantifies the amount of crowding in each arch. It compares the amount of space available, which is the arch perimeter with the space required or in other words the total mesiodistal widths of all the teeth to be aligned appropriately. This is critical in treatment planning as the treatment varies depending on the magnitude of crowding.[1]When the analysis is done in the mixed dentition, it would evaluate the amount of space required for the erupting permanent canine and premolars, providing valuable information on the likely degree of crowding. This has gained much interest with the emphasis on early treatment and interceptive orthodontics, as timely intervention of a developing malocclusion may reduce the severity of the possible malocclusions that might develop and it also may lessen the cost and complexity of subsequent orthodontic treatment.
Various methods have been devised in predicting the size of unerupted permanent teeth in mixed dentition.
Three methods are commonly used.
- Radiographic methods: Based on periapical and 45° cephalometric radiographs (Paula et al., 1995).
- Non-radiographic methods: Based on correlation and regression equations and prediction tables.
- Combinations of both methods.
Methods based on radiographs are considered the most precise as they develop a simple proportional relationship by comparing the size of a tooth that is seen both on the radiograph and the dental cast, for example, a primary molar. The technique is feasible both for the maxilla and mandible and for all ethnic groups irrespective of the gender. However, it requires time, specific equipment, and are less practical as they require undistorted radiographic images; furthermore, the radiation burden is not justifiable always (Proffit 2007. p. 428).
Therefore, recently, much interest has developed on the non- radiographic methods based on correlation and regression equations such as Moyers, Tanaka, and Johnston. As there are a range of studies providing evidence of an acceptable correlation between the size of incisors with the canines and premolars (Moyers, 1988),[3] several analyses have been applied in predicting the size of unerupted canines and premolars. Moyer’s probability table is the most widely used because it can be performed with equal reliability by a beginner and an expert as it does not require sophisticated clinical judgment. Furthermore, prediction through Moyer’s probability table is simple and does not require complicated instruments. However, as the confidence intervals were not defined and the results were not validated by any other study, Tanaka and Johnston developed a new regression equation. It was also simple and does not require radiographs or prediction tables (Tanaka and Johnston, 1974).
In 2003, a clinic-based research was done in Kandy District, Sri Lanka, to evaluate the applicability of Moyer’s probability table for a group of children attending the Orthodontic Unit, University of Peradeniya (Nagarathne, 2003). It had shown that the Moyer’s prediction table at 75th percentile should be used with caution in predicting the size of teeth in Sri Lankan Sinhalese females. As it was based on patients attending a tertiary care unit, the applicability of the results to the population is questionable. Furthermore, it had not validated the Tanaka and Johnston equation for the Sri Lankan population.
Therefore, our aim was to evaluate the applicability of Moyer’s probability table and the Tanaka and Johnston equation for children in Galle district, Sri Lanka.
MATERIALS AND METHODS
The sample size was decided to be 160 as the previous study done in 2003 on Sri Lankan population included 134 subjects. Study casts were obtained from 80 male and 80 female Sinhalese students with average ages of 13.9 and 14.7 years, respectively. Forty students were randomly selected from each educational zone in Galle district. The subjects were to have fully erupted mandibular permanent incisors, mandibular and maxillary permanent canines, and premolars. Those who had obvious loss of tooth material mesiodistally as a result of caries, fractures, congenital defects, or attrition of the teeth concerned were excluded. Furthermore, those having missing or supernumerary teeth, abnormally shaped or sized teeth, restorations of the teeth concerned, and previous history of orthodontic treatment and subjects with severe crowding or significant malocclusions were left out.Impressions were obtained from alginate impression material and study casts immediately poured with high-quality orthodontic model stone (Dental Stone Type III) to avoid any distortions. The teeth on casts were measured (the mandibular permanent central and lateral incisors, the mandibular and maxillary permanent canines, and the first and second premolars).
Measurements of the mesiodistal crown dimensions of the teeth were made using a digital caliper with a Vernier scale calibrated to the nearest 0.01 mm. A standardized method proposed by Hunter and Priest in 1960 was used to measure the mesiodistal crown dimensions.[4] The caliper was held at the tooth’s greatest mesiodistal diameter (contact points), with the sliding caliper parallel to the occlusal surface and perpendicular to the tooth’s long axis. Measurements were made by a single investigator. In each case, two separate measurements of each tooth were taken at two different time intervals, and the mean value was used for further data analysis if a discrepancy existed among the readings. The values obtained for the right and left canine premolar segments in each arch was averaged so that there would be one value for the mandibular canine–premolar segment and one value for the maxillary canine–premolar segment for each value of the combined mandibular incisors. To avoid eye fatigue, the examiner analyzed only five pairs of casts per day.
To test the reliability of the measurements, blind duplicate measurement of tooth size was done in 10% of the casts based on systematic random selection of 10th cast (both maxillary and mandibular) at an interval of 1 week.
The two prediction methods were used in this study:
- Moyers method: Probability chart at 75th percentile level was used to estimate the widths of mandibular and maxillary permanent canines and premolars.
- Tanaka and Johnston equation: Mesiodistal widths of mandibular and maxillary permanent canine and premolars were estimated by summing 10.5 mm and 11 mm, respectively, to the half of the sum of the lower four permanent incisors.
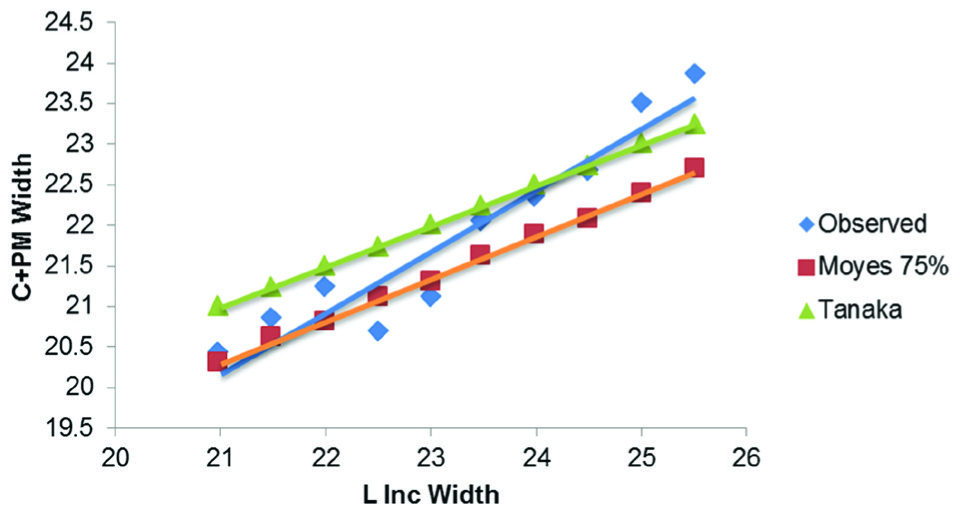
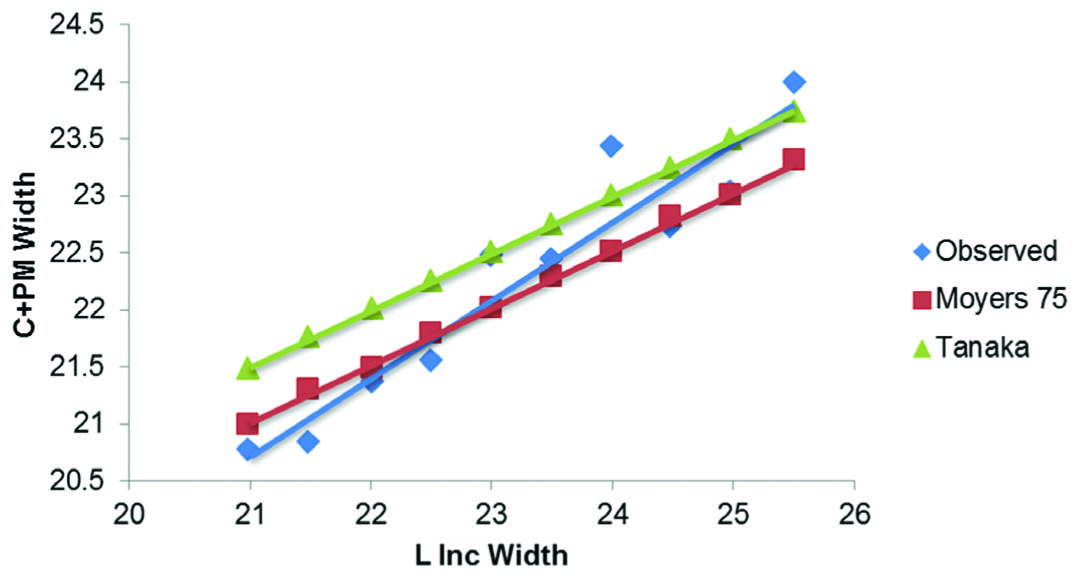
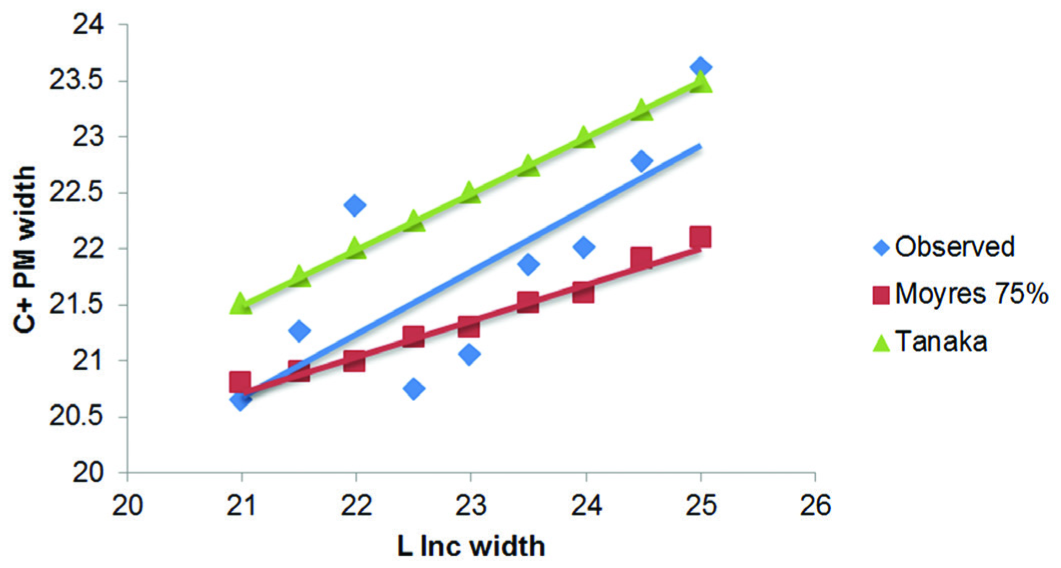
RESULTS
There was no statistically significant difference between the left and right sides of maxillary and mandibular arches in both the genders. In both males and females, both the prediction methods tended to underestimate the size of the canine and premolars when the combined lower incisor widths were increasing in size.Mandibular arch in males

Close
Close

Close
Close

Close
Close

Close
DISCUSSION
As there was a statistically significant difference between actual and predicted widths of permanent canines and premolars (P = 0.01), the Moyer’s prediction table and Tanaka Johnston equation must be carefully used for children in Galle District, Sri Lanka. It has been shown in a review article that radiographic methods are the most accurate (Irwin, 1995). Furthermore, systematic reviews and meta-analysis done on the applicability of tooth size prediction methods in the mixed dentition has shown that the non- radiographic methods are only suitable for the population they were derived from. Prediction tables and regression equations have shown to have population variations, and they cannot be universally applied without question. The applicability of the prediction tables for other populations has been studied, and some have proposed altered individual probability tables and sometimes new regression equations, for example, Schirmer and Wiltshire 1997 for Native South Africans; Yuen et al. 1998 for Chinese population; Lee-Chan et al. 1998 for Asian-Americans; and Jaroontham and Godfrey 2000 for Thai population.[5,6]As our sample only included subjects from one district, it is difficult for us to generalize the observation for our population. However, when considering the previous research done on another district, it is obvious that these two non-radiographic prediction methods are not as accurate as expected for our population.
CONCLUSION
Moyer’s prediction table and Tanaka Johnston equation must be carefully used for children in Galle District, Sri Lanka. Therefore, it might be safer to develop regression equations for Sri Lankan population.References
- Bishara SE, Jakobsen JR. Comparison of two nonradiographic methods of predicting permanent tooth size in the mixed dentition. Am J Orthod Dentofacial Orthop. 1998;114:573-6
[CrossRef] [Google Scholar]
- Huckaba GW. Arch size analysis and tooth size prediction. Dent Clin North Am. 1964;11:431-40
[Google Scholar]
- Hunter WS, Priest WR. Errors and discrepancies in measurements of tooth size. J Dent Res. 1960;39:405-14
[CrossRef] [PubMed] [Google Scholar]
- Jaroontham J, Godfrey K. Mixed dentition space analysis in a Thai population. Euro J Orthod. 2000;22:127-34
[CrossRef] [PubMed] [Google Scholar]
- Lee-Chan S, Jacobson BN, Chwa KH, Jacobson RS. Mixed dentition analysis for Asian-Americans. Am J Orthod Dentofacial Orthop. 1998;113:293-9
[CrossRef] [Google Scholar]
Sections
Show Sections
Δεν υπάρχουν σχόλια:
Δημοσίευση σχολίου